Interactive Sales Analytics Dashboard
A retail analytics dashboard that turns flat order-line records into order baskets, temporal trajectories and product matrices — entirely client-side, with sub-millisecond filtering and no server round trips.
1 / 4
What it is
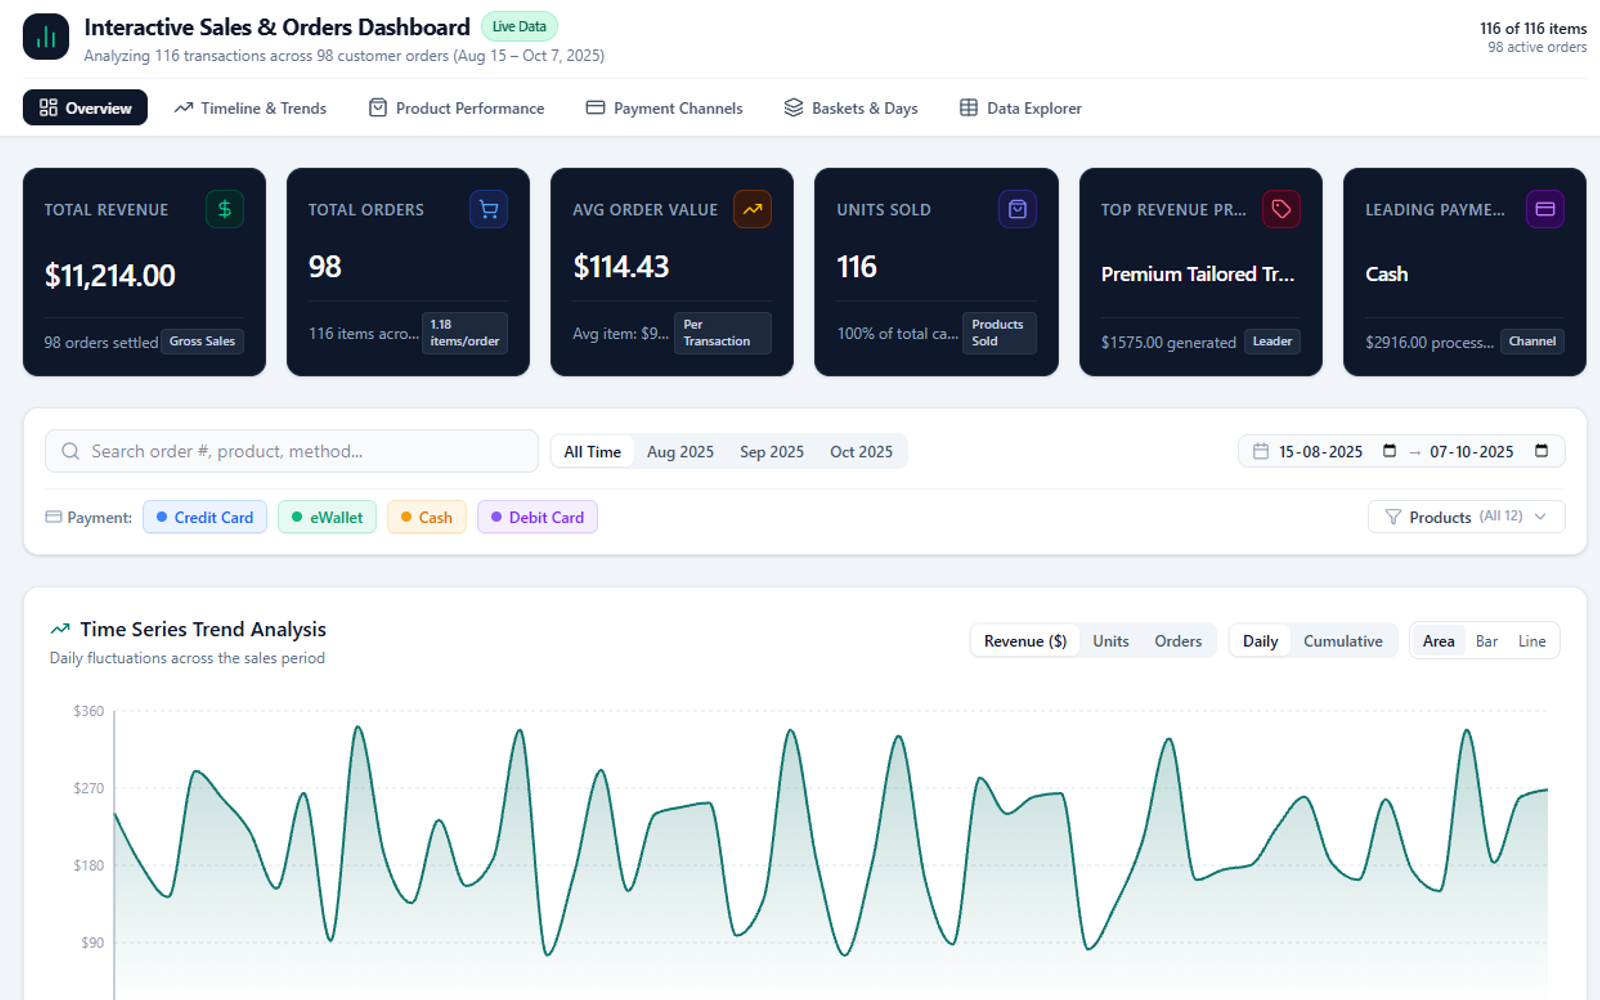
A client-side analytics application over retail commerce data — 116 transactions across 98 customer orders in the reference dataset. It takes flat order-line records and builds the relational views a merchandiser actually thinks in: order baskets, time series, channel performance, product matrices.
Everything runs in the browser. No backend, no API calls, no loading states between a filter change and a redrawn chart.
The modelling decision that made it work
Retail data arrives as line items, but half the questions are about orders. Revenue per product is a line-item question. Average order value, basket size and payment method are order-level questions. Answer them from the same flat table and you double-count or undercount, depending on which mistake you make.
So the enrichment pipeline builds 2 parallel scopes from a single source — filtered items and filtered baskets — and every visualisation declares which one it reads from. The filter state is shared; the aggregation is not.
It also does calendar indexing up front: ISO date parsing, day-of-week, month and week number. Those are cheap to compute once and expensive to recompute per render, and they unlock the questions people actually ask (“which day do we sell most?”).
What it shows
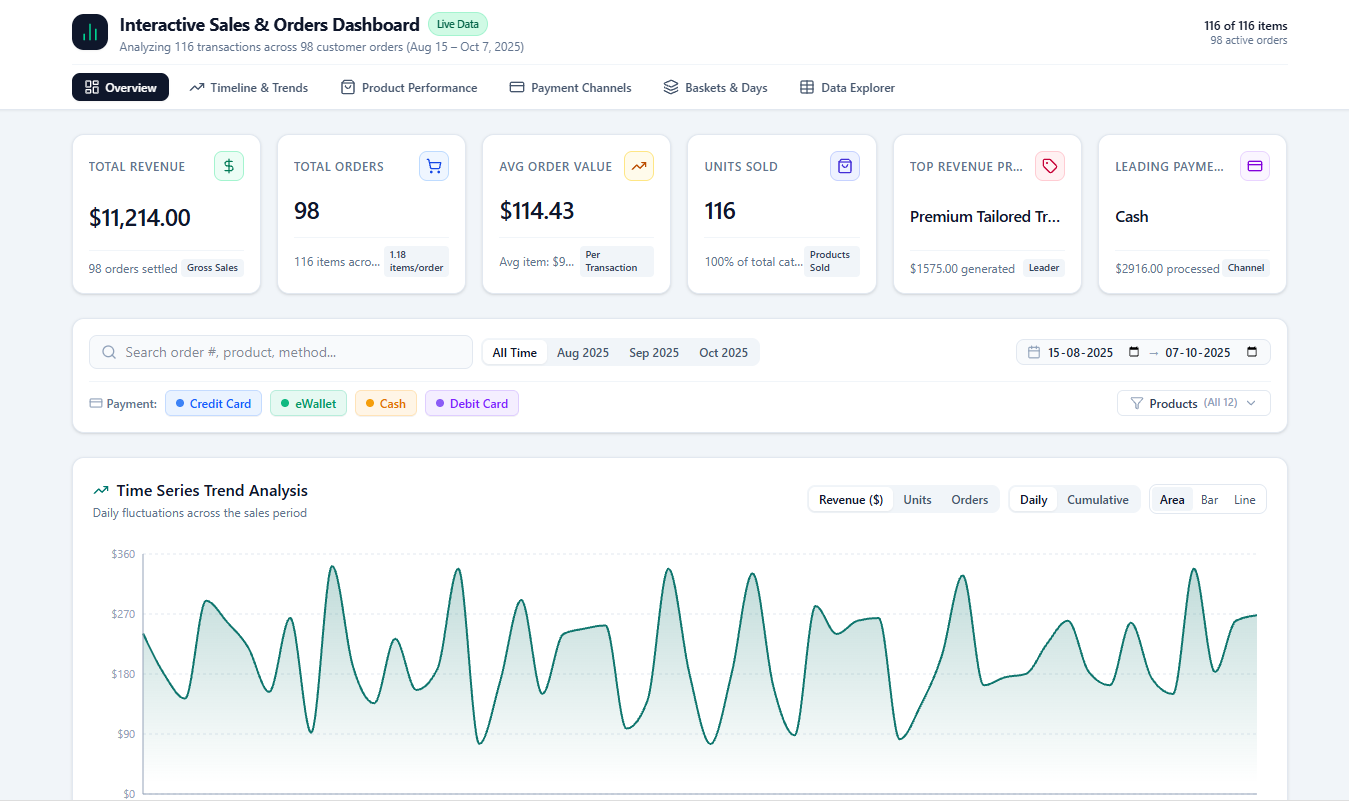
- Executive KPI cards — revenue, average order value, order count, leaders
- Time series with area, bar and line modes plus a cumulative toggle
- Product ranking and price elasticity as a scatter bubble plot
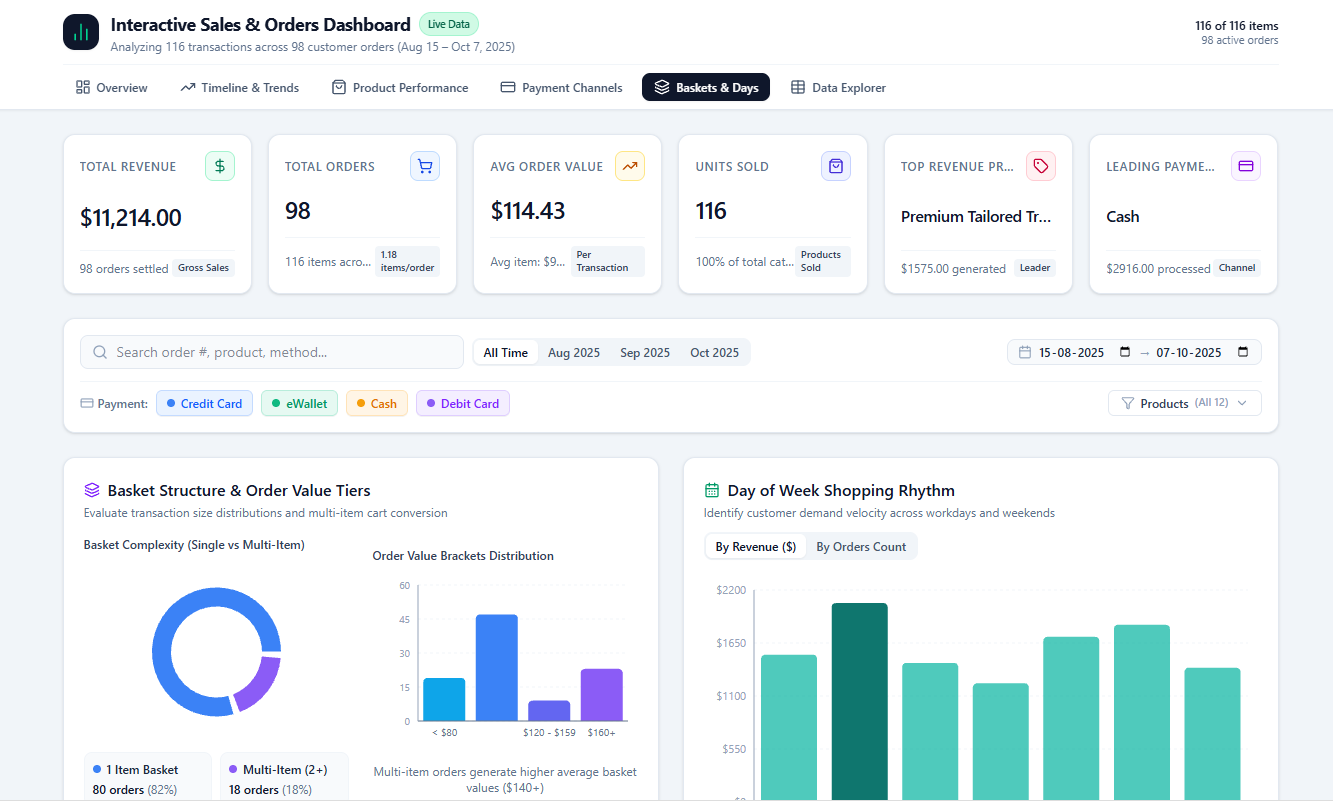
- Basket structure and order value tiers
- Day-of-week shopping rhythm
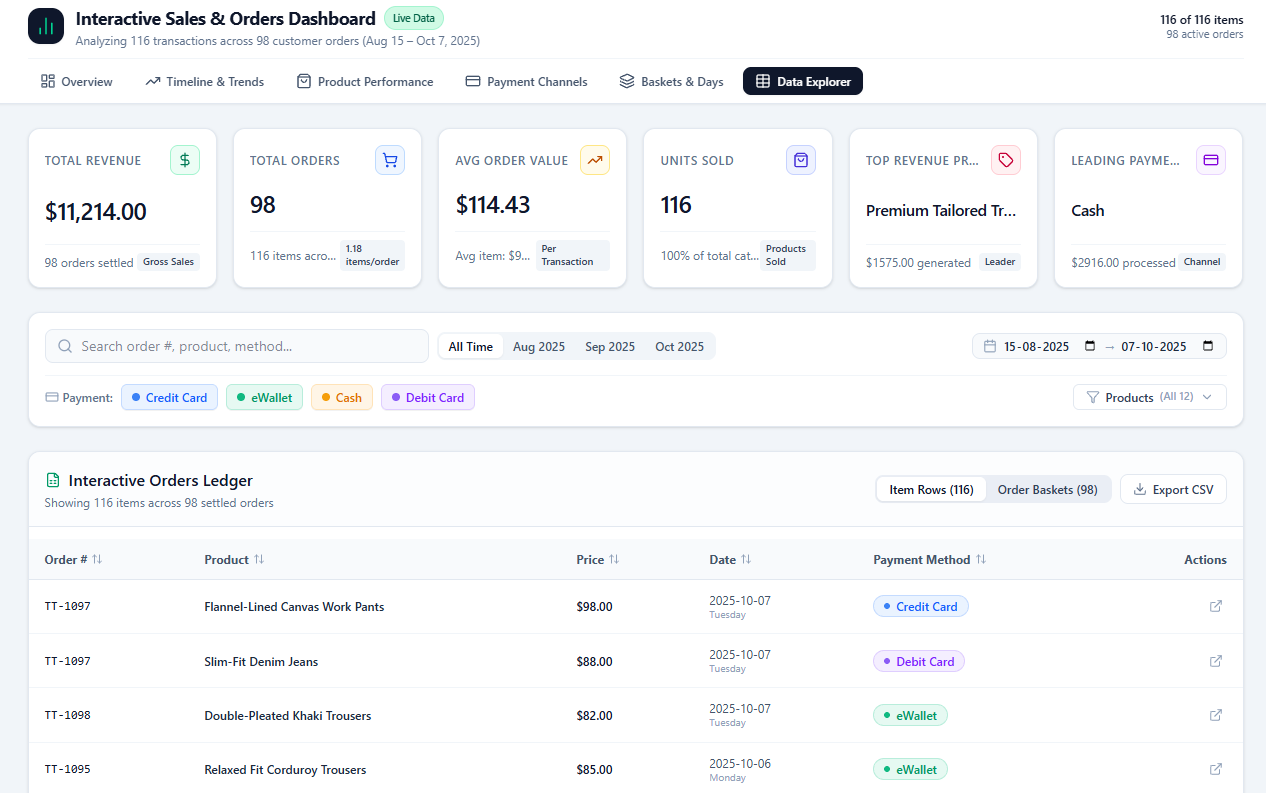
- An orders ledger for reading individual transactions
Filters — date range, search, payment method, product selection — apply to everything at once, unidirectionally.
Why client-side
With a dataset this size, every server round trip is latency spent on something the browser can do in under a millisecond. Removing the server removed loading states, and removing loading states changed how the thing is used: you stop composing a query and start moving the date range around to see what happens.
That is a different product, and it only works because the scale allows it. This architecture does not survive 1 million rows, and that is a deliberate trade rather than an oversight.
Stack
React 19, TypeScript, Vite, Tailwind, Recharts for SVG rendering. Defensive parsing on ingest, memoised aggregation, and responsive rules so every chart stays readable down to phone width.
What I learned
Pick the grain before you pick the chart. Nearly every wrong number in a retail dashboard traces back to aggregating line items when the question was about orders. Making the two scopes explicit in the data layer meant no individual chart had to be careful.
Sub-millisecond filtering changes user behaviour. The feature is not that it is fast — it is that speed makes exploration feel free, and people explore.
Enrich once, at the boundary. Calendar fields, basket rollups and derived totals are computed on ingest, so the render path only reads. It keeps the component code boring, which is what you want in the part that runs 60 times a second.